Blog

Data Highlight: Learning About the Internet in Turkey

  • Posted on: 11 August 2016
  • By: Grant Baker

In Turkey’s recent coup, social media and messaging services such as Whatsapp played a large role. In the aftermath of the coup, the government blocked and continues to block various websites across the internet. The Net Data Directory has a number of data sources that contain information on Turkey's complex digital environment.

Turkstat, a government website, provides the most basic and foundational data about internet infrastructure and usage in Turkey. The “Information Society Statistics” report includes information on computer usage, internet access, and the number of websites registered to both individuals and businesses from 2005 to 2015. The government breaks down individual internet and computer usage by gender; as of 2015 around 65% of both computer and internet users are male, despite the fact that the ratio of men and women in Turkey is close to 1:1. Though men comprise the majority of internet users, the number of women using the internet has been increasing each year since 2005. As far as businesses are concerned, over 65% of Turkish businesses had their own website in 2015, up from 48.2% in 2005.

Although having a website is an important for businesses, the growth of online advertising may shed more light on the economic impact of the internet in Turkey. The Interactive Advertising Bureau publishes regular reports on the state of digital advertising in various countries, including Turkey. A recent report, some of which can be seen below, found that revenue from digital advertising grew 18.8% in Turkey between 2014 and 2015, but revenue from mobile advertising grew 60.1%, with approximately 30% increases in both video advertisements and in-game mobile advertising. Advertising information can help researchers understand how active internet users are and what types of content these users are accessing.

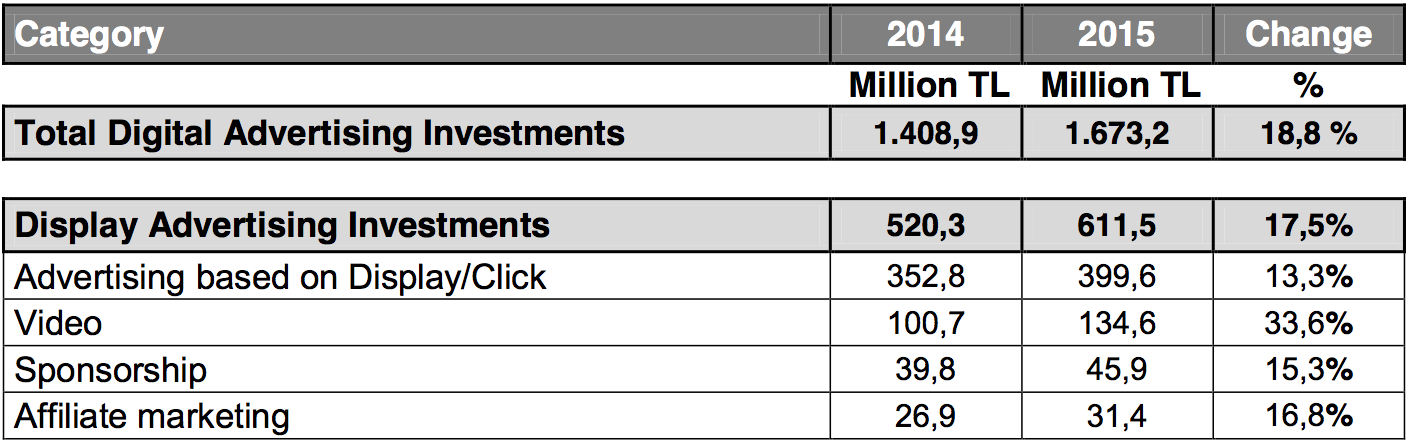
(TL stands for Turkish Lira)

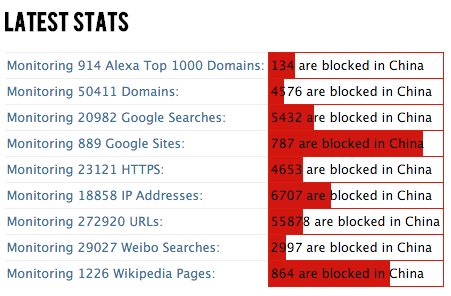
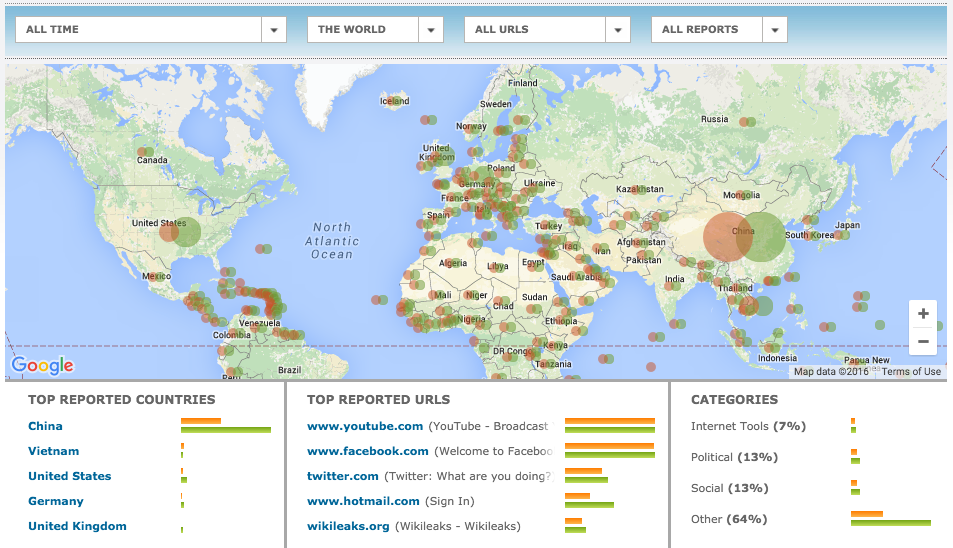
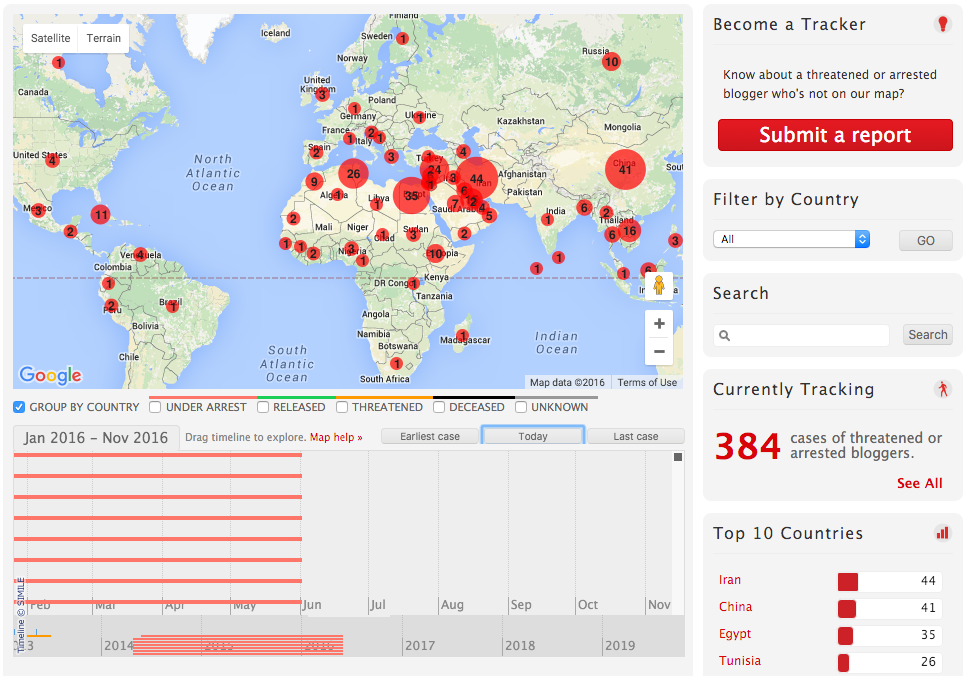
The Net Data Directory also has data sources that help paint a picture of internet freedom. For example, the Open Net Initiative (ONI) offers information on internet filtering in Turkey. In 2010, it found that Turkey selectively filtered political content, social content, and internet tools. Furthermore, the report also contains information on regulations, laws, and filtering systems in Turkey. The report also analyzes political factors such as the impact of Turkey’s quest for EU membership on Turkey’s regulation on internet speech. While this report is almost five years old, there are other more recent sources on the Net Data Directory regarding internet censorship.

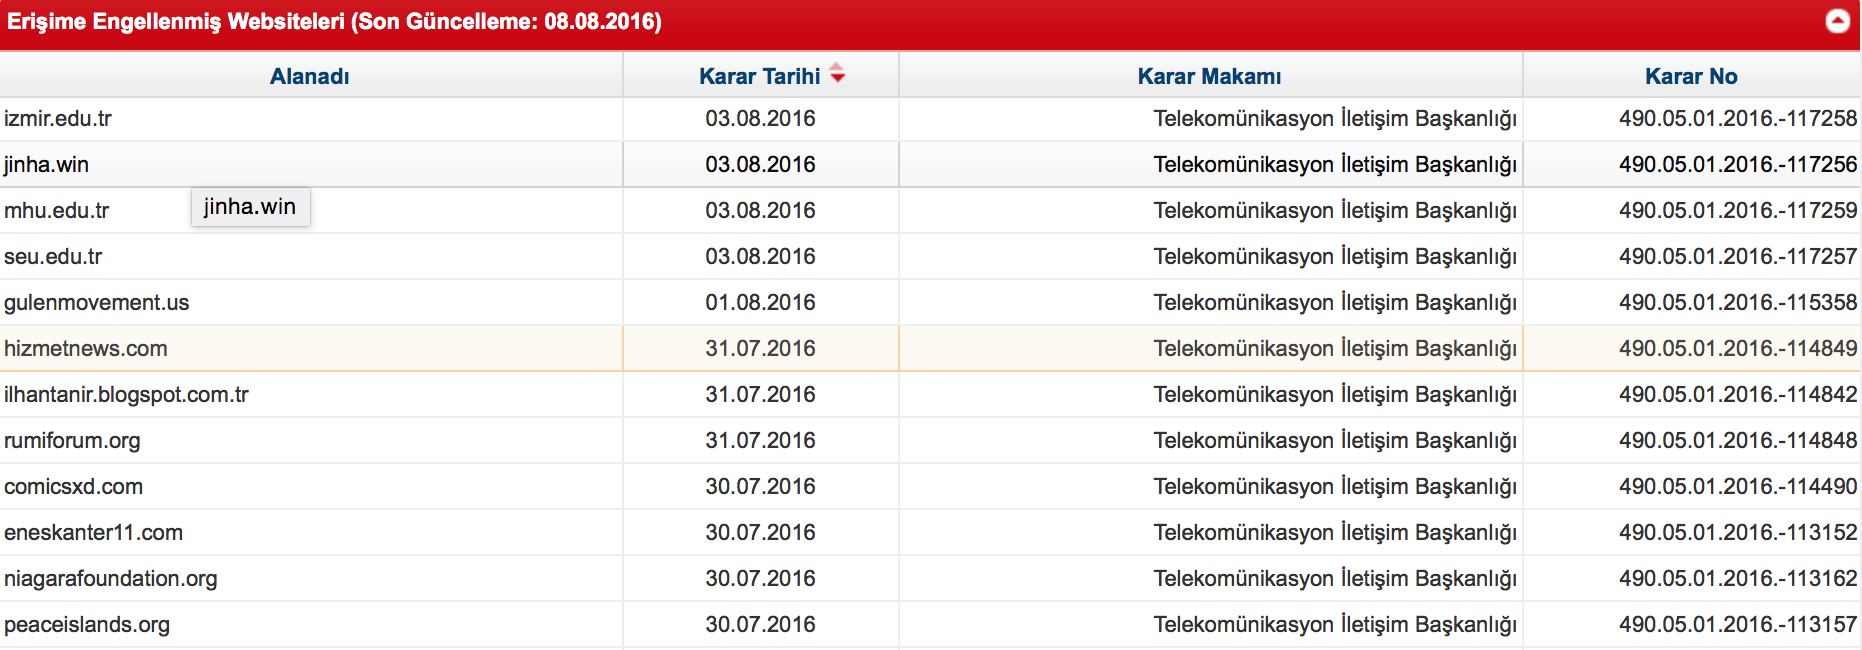
Engelli Web, a Turkish language website, lists website blockages in Turkey as they occur and provides the source for the blocks, such as the agency of the government that ordered them and the dates of the blocks. The website also includes a blog, usually updated a couple of times each year, which describes some of the more notable blocks.  Recently, the government has blocked various Gulenist websites in the wake of the coup. Just days before the family of Enes Gulen (formerly Enes Kanter), the NBA basketball player who supports Fethullah Gulen, disowned him, the Turkish government blocked his personal website, Eneskanter11.com.

Interested in learning more? Check out all of our data sources that contain information on Turkey.

Data Highlight: Learning About the Internet in China

  • Posted on: 5 August 2016
  • By: Patrick Drown

China has by far the most Internet users in the world (around 720 million at the beginning of 2016). Yet many Chinese Internet users are unable to access a free and open internet. GreatFire, a project that tracks Internet censorship in China, has recorded in 2016 that of the 49,119 websites it regularly monitors, 4,455 were blocked. The three most widely used websites in the US—Google, Facebook, and YouTube—are all blocked. To understand how and why China censors content and what Chinese citizens are doing to circumvent this censorship, the Net Data Directory includes a number of databases that shed light on the Chinese Internet environment.

GreatFire monitors the degree of censorship throughout China and provides links to a number of applications and websites that allow netizens to circumvent censorship. GreatFire is most known for its work in providing data on which websites are censored in China. Below is an example of the kind of data the GreatFire provides. In addition to offering a large database of availability data on websites in China, GreatFire has a feature that allows visitors to test the availability of URLs in China.

The CNNIC (China Internet Network Information Center) provides detailed quantitative and qualitative information on the nature of Internet in China. On the site you can find information about the number of broadband and mobile Internet subscribers, statistics about .cn domain registration, and annual reports that explain Internet development in China. Below is a chart from CNNIC showing the breakdown of the types of .cn registrations.

APCERT (Asia Pacific Computer Emergency Response Team) seeks to ensure Internet security in the Asia Pacific region. The network publishes yearly reports with detailed information on issues such as malware, virus, phishing, spam, DDoS, and defacement. A large portion of its work surrounds spreading information on these issues that are related to China. Below is a chart that was included in APCERT’s 2015 annual report that shows the portions of categories for incident complaints reported by CNCERT, which is a non-governmental non-profit cybersecurity technical center and the key coordination team for China’s cybersecurity emergency response community.

The Web Index offers profiles of Internet environments and policies in nearly 90 countries. The platform allows users to easily compare the role of the Internet in different countries’ political, social, and economic landscapes. Each country is given a rank based on its score in four categories: degree of universality of access to the Internet, relevant content, freedom and openness, and empowerment. Though many people are quick to give China one of the worst reputations for creating a hostile Internet environment, the Web Index ranks China as average in comparison to the other ranked countries. The Web Index covers 86 countries; China is ranked 44th. China arrives at this ranking because it has a relatively high ranking for economic impact (28) and universal access (36), despite its low ranking for freedom and openness (80). When you select a country, the Web Index automatically creates a bar chart that compares the country to other countries in the region, which is shown below for China.


Data Highlight: Twiplomacy and Politwoops Explore the Ways Politicians Use Twitter

  • Posted on: 14 July 2016
  • By: Grant Baker

Barack Obama joined Twitter in 2007, which makes him the first head of state to have a Twitter account; however, now this is common practice. Even in countries like Iran, where Twitter is regularly blocked, the president, Hassan Rouhani, maintains a Twitter account in English and Persian. While some leaders still do not have Twitter, it is far more popular now than it was in 2007, and world leaders are learning to use the social media platform in new ways. Two projects listed in the Net Data Directory are collecting and sharing data about how politicians and governments use Twitter.

Twiplomacy, a tool developed by public relations firm Burson-Marsteller, tracks the ways heads of state and state departments utilize social media, with a focus on Twitter. The Twiplomacy website contains an interactive map; users can click on each continent for a list of facts on social media use or select a country to see the most popular government accounts in that country and how each one uses Twitter. This interactive map enables users to compare and contrast the different Twitter strategies of leaders in each country. For example, smaller countries often have different strategies for engaging followers on Twitter than larger ones might. In Iceland, 94% of the Twitter traffic comes from abroad; therefore, the government made the decision to tweet in English to better engage with its followers.

Each year Twiplomacy reports highlights and new trends on Twitter. In the most recent report, Twiplomacy featured the first politicians to use Emojis on Twitter (Juan Manuel Santos, president of Colombia, and Julie Bishop, an Australian MP), the governments that pay for Twitter advertisements (Japan and Monaco), and the foreign officials Barack Obama follows (Dmitry Medvedev, Malcom Turnbull, and Erna Solberg). Twiplomacy also reports on broader trends across Twitter. Twiplomacy found that for heads of state, Twitter is still a predominantly text-based social network, though some official accounts are tweeting GIFs and using new video tools like Periscope or Vine. Predictably, tweets with images or video often perform better, but Twiplomacy also noted that many of the highest performing tweets occurred during tragedies. That said, tragedies are not always the best time to tweet; one particularly poorly timed tweet occurred when “The U.S. Mission in the Philippines had scheduled a post about an invitation to a garden party at the mission while a tropical cyclone was wreaking havoc in the country.”

Sometimes, governments, foreign offices and politicians try to delete tweets like these in an effort to cover up any mishaps. Politwoops, a site from the Sunlight Foundation in the United States and the Open State Foundation in the European Union, catalogues these deleted tweets. The popular website uses Twitter’s API to track and publish deleted tweets from government officials. In an interview with the Internet Monitor, Nicko Margolies, Politwoops Project Lead at the Sunlight Foundation, explained the process: after receiving a notification of a deleted tweet through the API, Politwoops  “would compare it to the public feed of the politician to see if it was a minor error that was corrected and if not, it would be approved to appear in Politwoop’s archive.” The site was met with some resistance in mid-2015 when Twitter restricted use of the API, but by the end of 2015, Politwoops and Twitter were able to reach an agreement, which allowed the site to return. In addition to displaying the tweets on its website, Politwoops displays how long it took for each politician to delete the tweet in question. One of the most famous deletions happened in 2014, when Sergeant Bowe Bergdahl returned to the United States after the Taliban held him captive for five years. Bergdahl’s return was complicated because of both the decisions he made that led to his capture and the prisoner exchange that led to his return.  Many Republican lawmakers initially tweeted their relief and happiness for Bergdahl’s release, but once they found out about the prisoner exchange with the Taliban, they quickly deleted these tweets.

Both Twiplomacy and Politwoops are located in the Net Data directory and can be incredibly useful to see how politicians have used—or in some cases, struggled to use—Twitter effectively.

Data Highlight: Map Applications of the Internet

  • Posted on: 11 July 2016
  • By: Patrick Drown

In many ways the internet is removed from our spatial reality. One Twitter user can retweet a post from another user halfway across the globe. Communities on the internet are often formed based on specific interests, not on geographic location. But, in other ways, our internet experience is shaped by the geopolitical atmosphere of our world. Domestic governance, relations between different countries, culture, and language still affect how we use the internet and who we interact with. Interested in learning about what these forces look like? The Net Data Directory offers a number of maps that can help.

The Digital Attack Map shows where in the world Distributed Denial of Service (DDoS) attacks are happening. The map indicates to the viewer from what countries attacks are carried out and in what countries attacks are experienced, as well as the volume and intensity of each attack. Sometimes only the place of an attack or the place attacks are being sent from is known, which is also reflected in the map. Below the map is a listing of major headlines of the day related to DDoS attacks, which can potentially help explain the current day’s trend of attacks. In addition the website has a collection of archived maps that show days in history with a high and unusual volume of DDoS attacks that are often associated with large cybersecurity events. Unsure of what a DDoS attack is and how it happens? Check out the webpage’s explanation.

The screenshot above indicates the top ~2% of reported DDoS attacks for June 22, 2016. The viewer can see which countries experience the most attacks and which countries carry out the most attacks. The site itself is interactive, showing which direction the lines are moving (which indicates if a country is being attacked or doing the attacking), so be sure to check out the digital map. As an example, the large series of circles are leaving Brazil, indicating that a high volume of DDoS attacks are coming from Brazil.

Telegeography, which labels itself the authority on telecom data, has a number of maps that show the relationships between geography and communication, whether it telecommunications-focused or interaction on the web. The Global Internet Map shows how international data routes connect hub cities in the world and provides insight into regional bandwidth capacities. The map shows the highest capacity routes between the US and Europe and among various countries in Europe itself. Other maps include the world’s network of submarine cables, global voice traffic, and visual information on Internet exchange points.

One of the many maps on Teleography is an interactive map that shows Internet Exchange points across the globe. An Internet Exchange point (IXP) is a physical network access point through which major network providers connect their networks and exchange traffic. The Internet Exchange points are provided in list form on the right hand side of the map.

Herdict, a project of the Berkman Klein Center for Internet & Society, demonstrates on an interactive map reports of website unavailability across the globe. Each country on the map has two circles, one that shows the number of reported available websites and one that indicates the number of reported unavailable websites. Below the map, the top reported countries are listed, along with a visual that shows how many websites are reported available and how many are reported unavailable. The top three reported countries right now are China, Vietnam, and the United States. The top reported URLs are www.youtube.com, www.facebook.com, and twitter.com. The map relies on data that users contribute; the aggregate data collected is the verdict of the herd—the Herdict.

The interactive map of Herdict is captured above and shows the number of available and unavailable site reports for all time. Data filtering features are included above the map, and below the map, the user can view top reported countries, top reported URLs, and in what categories URLs are reported.

Threatened Voices tracks where in the world online journalists and bloggers are arrested or are in danger of being arrested, based on research and reports from the Threatened Voices team. The map not only provides status updates of each blogger and journalist but also shows the total number of arrested or threatened bloggers that have been reported in each country. The platform allows users to submit cases of the arrest or threatening of bloggers if they aren’t already captured on the map. Threatened Voices is infrequently updated, but the platform has been highlighted on this post because of its features that can help you understand the scope of threatened bloggers, journalists, and activists around the world.

Above is a look at the Threatened Voice map on June 22, 2016. The number in each red circle represents the number of arrested or threatened bloggers in a particular country. The interactive map allows the user to filter by country, track the status of specific bloggers, and view aggregate data like the total number of threatened or arrested bloggers or the top 10 countries with arrested or threatened bloggers.

Be sure to check out these sites for a map-based look at our digital world! These are only a few of many data sources listed in the Net Data Directory that shed light on the geopolitical element of the internet.

Announcing the Net Data Directory

  • Posted on: 2 June 2016
  • By: admin

The Berkman Center for Internet & Society is delighted to announce the launch of the Net Data Directory, a free, publicly available, searchable database of different sources of data about the Internet. The directory is intended to make finding useful quantitative data about a broad range of Internet-related topics—broadband, cybersecurity, freedom of expression, and more—easier for researchers, policymakers, journalists, and the public.

"A large number of organizations are producing data about all different facets of the Internet," said Fernando Bermejo, Berkman Center Faculty Associate and founder of the project. "However, it is not always easy to identify those sources and obtain the data. We hope the Net Data Directory will help anyone interested in knowing about the current state of the Internet to find the data they need in order to make informed decisions, produce insightful research, or simply learn something new about the online world.”

Records in the directory include the name of the data source, a short description of the available data, and a link. Data sources are tagged both by geographic coverage (including global, regional, and country-level tags) and by topic (such as broadband, cybersecurity, and social media). Users can search, sort, and filter records within this database to identify datasets relevant to their work. The vast majority of datasets within the directory are themselves open and publicly available.

The Net Data Directory currently contains over 150 data source records, ranging from the Interactive Advertising Bureau's regular reports on online advertising revenue to the European Union's Eurobarometer, which publishes data collected through public opinion surveys on a wide range of issues including data protection and digital markets; Tiobe, which offers a monthly index of the popularity of different programming languages; the Economic and Social Commission for Asia and the Pacific's digital data explorer; the Digital Attack Map, a collaboration between Google Ideas and Arbor Networks that provides daily information on DDoS attacks worldwide; AFRINIC's set of statistics on IPv4, IPv6, and AS numbers in Africa and the Indian Ocean; the OECD's Broadband Portal and other ICT indicators; and many more. Records are maintained by researchers at the Berkman Center; users can also suggest new data sources through the NDD website. 

The Net Data Directory is a partner of Internet Monitor, a research project based at the Berkman Center that aims to evaluate, describe, and summarize the means, mechanisms, and extent of Internet content controls and Internet activity around the world.

About the Net Data Directory

The Net Data Directory is a free, publicly accessible database of information about different sources of data about the Internet. The directory is intended to make finding reliable quantitative data about a broad range of Internet-related topics—broadband, cybersecurity, freedom of expression, and more—easier for researchers, policymakers, journalists, and the public. For more, see netdatadirectory.org.

About Internet Monitor

Internet Monitor is a research project based at Harvard University's Berkman Center for Internet & Society. Internet Monitor's aim is to evaluate, describe, and summarize the means, mechanisms, and extent of Internet content controls and Internet activity around the world. The project helps researchers, advocates, policymakers, and user communities understand trends in Internet health and activity through research, analysis, and data visualization. Internet Monitor is funded by the US Department of State and the MacArthur Foundation. For more, see thenetmonitor.org.

About the Berkman Center

Founded in 1997, the Berkman Center for Internet & Society at Harvard University is dedicated to exploring, understanding, and shaping the development of the digitally-networked environment. A diverse, interdisciplinary community of scholars, practitioners, technologists, policy experts, and advocates, we seek to tackle the most important challenges of the digital age while keeping a focus on tangible real-world impact in the public interest. Our faculty, fellows, staff and affiliates conduct research, build tools and platforms, educate others, form bridges and facilitate dialogue across and among diverse communities. More information at www.cyber.law.harvard.edu.